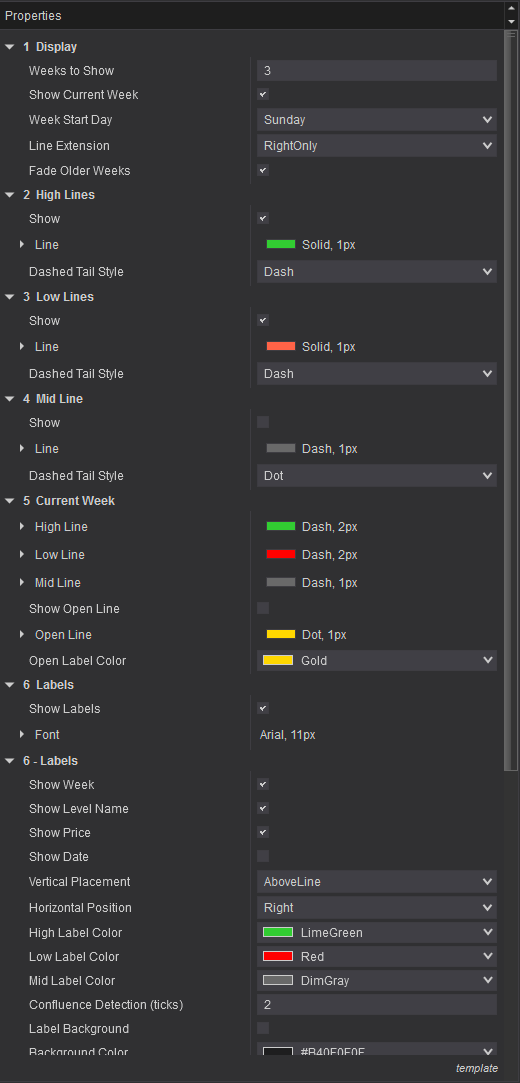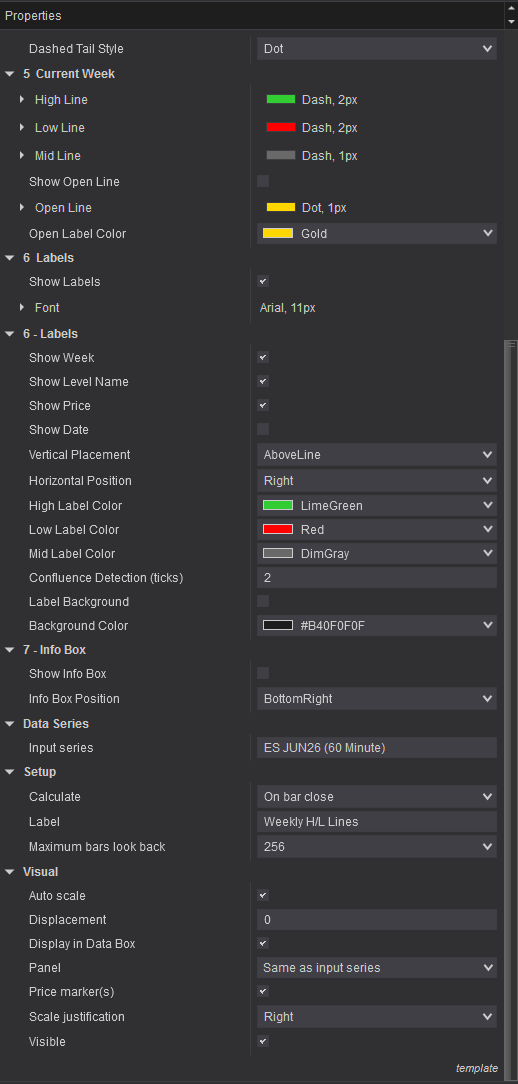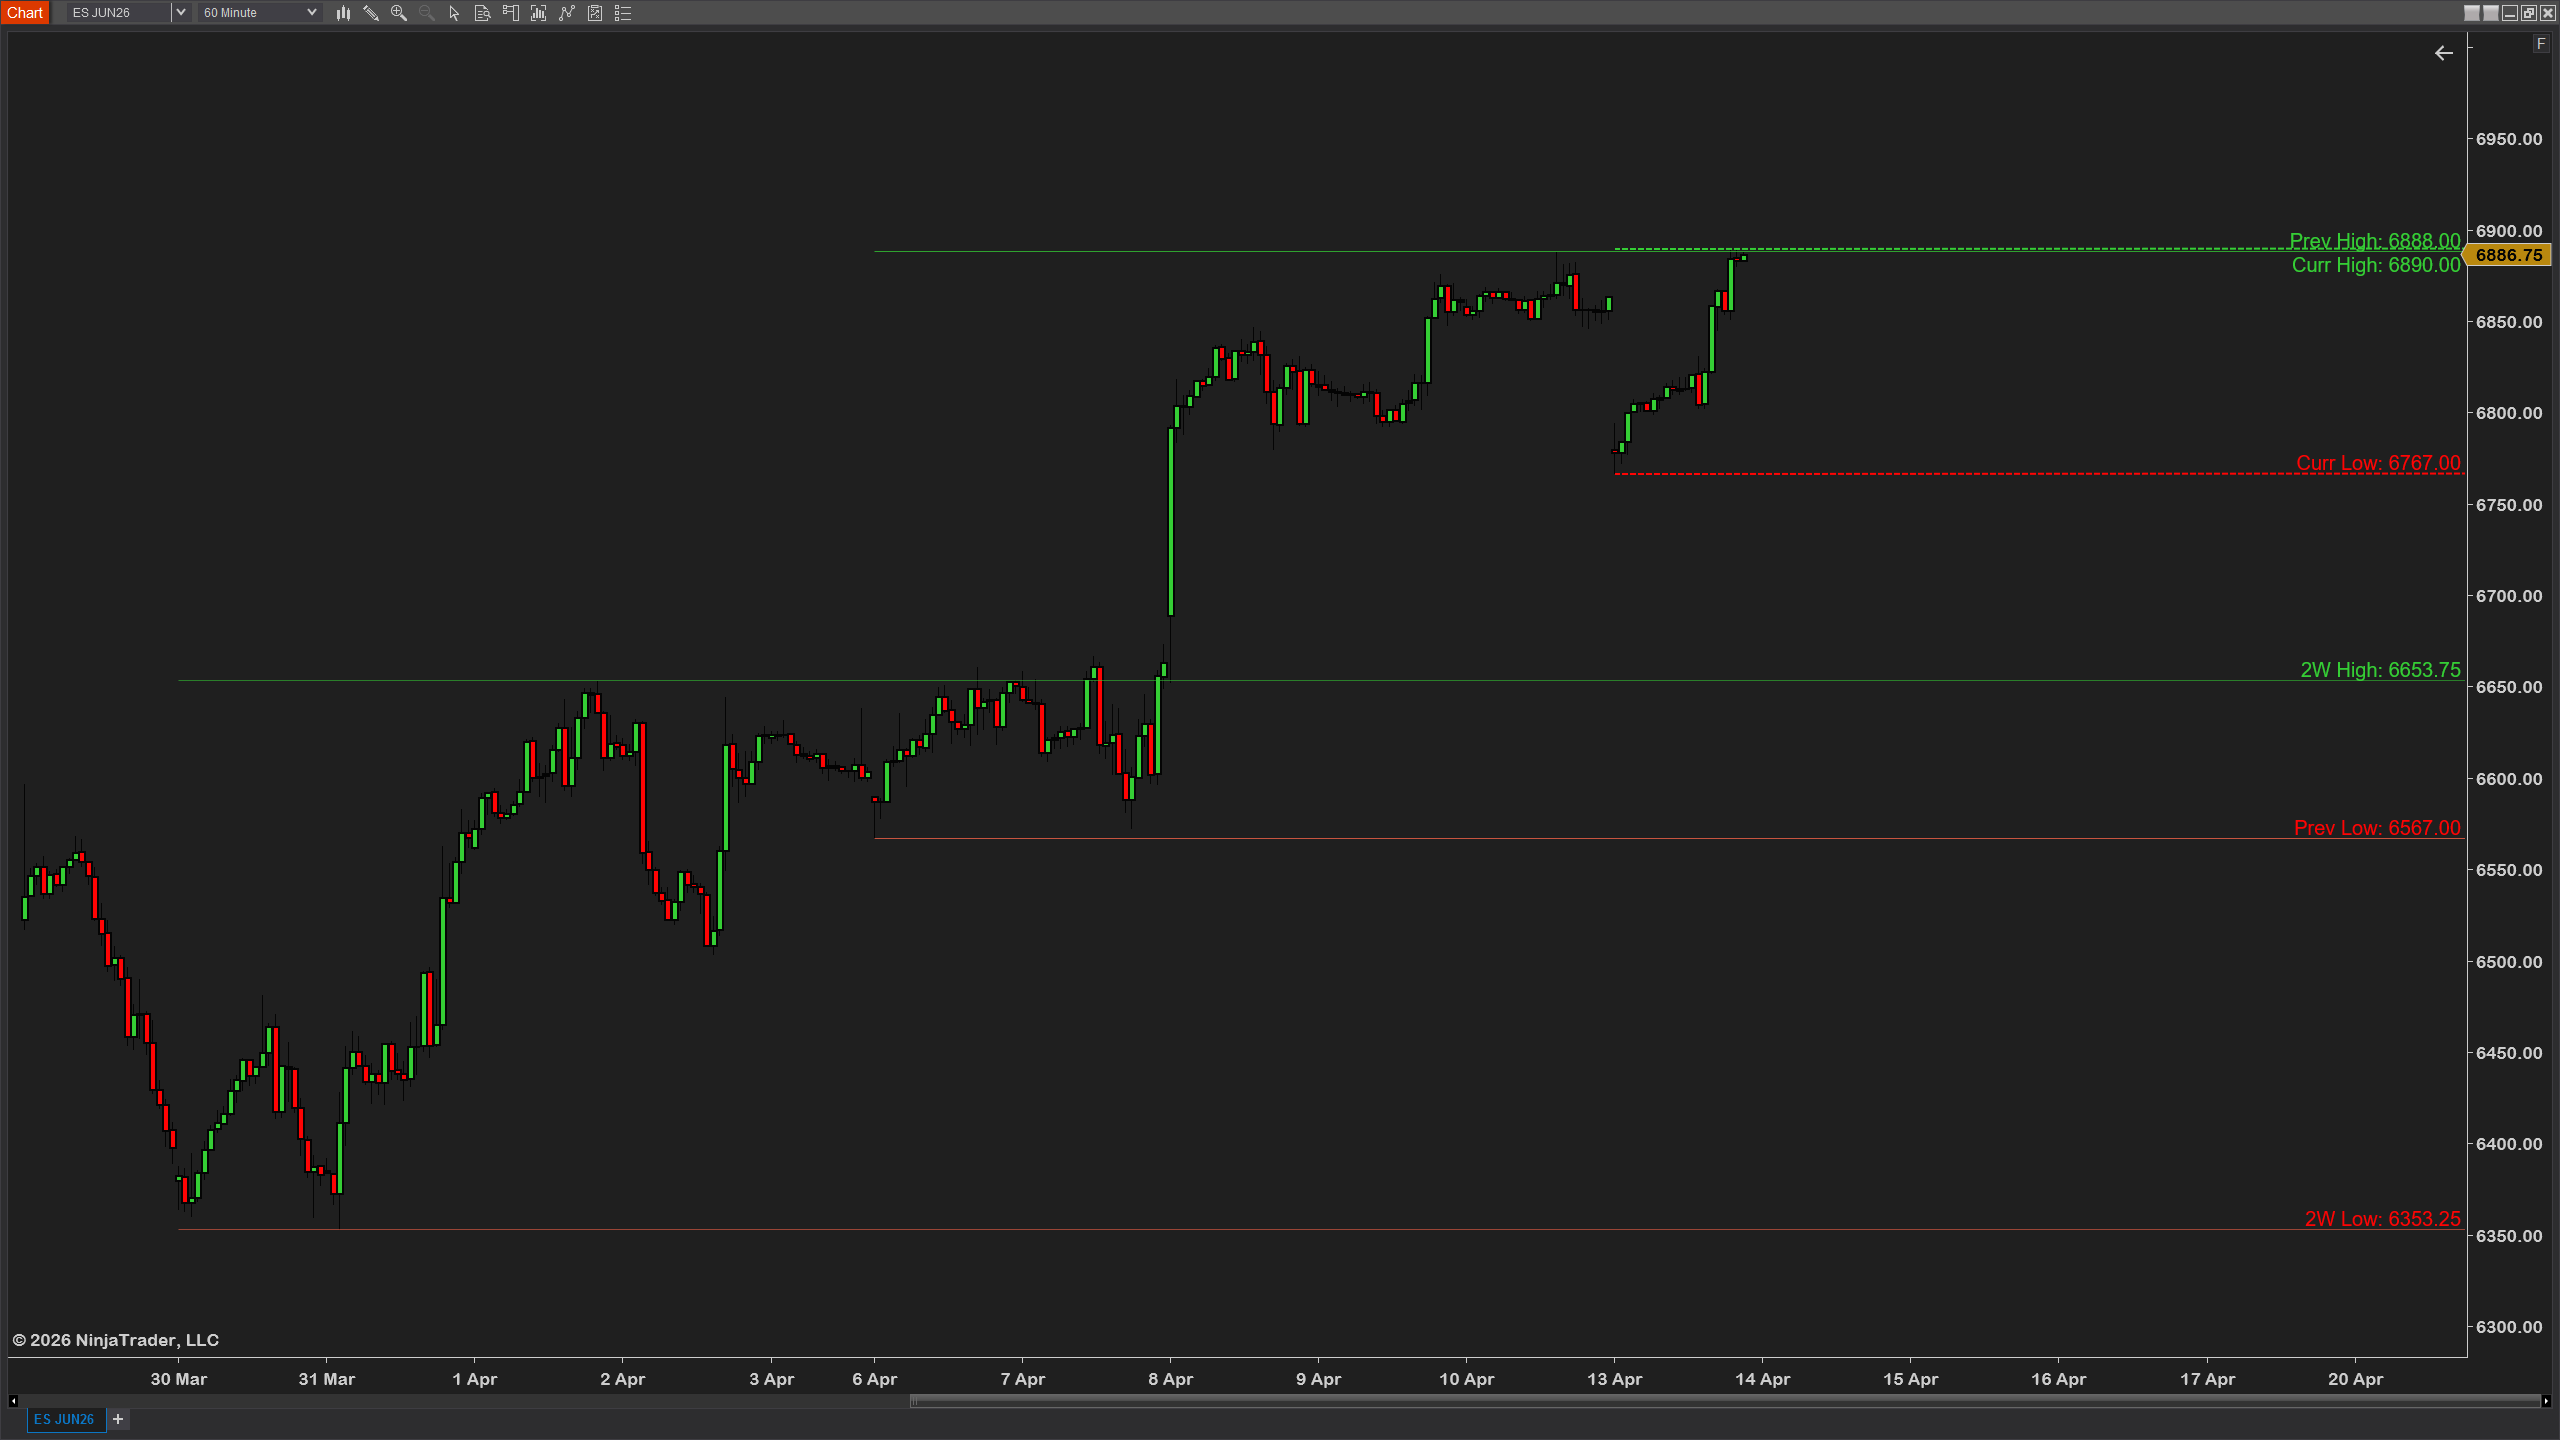
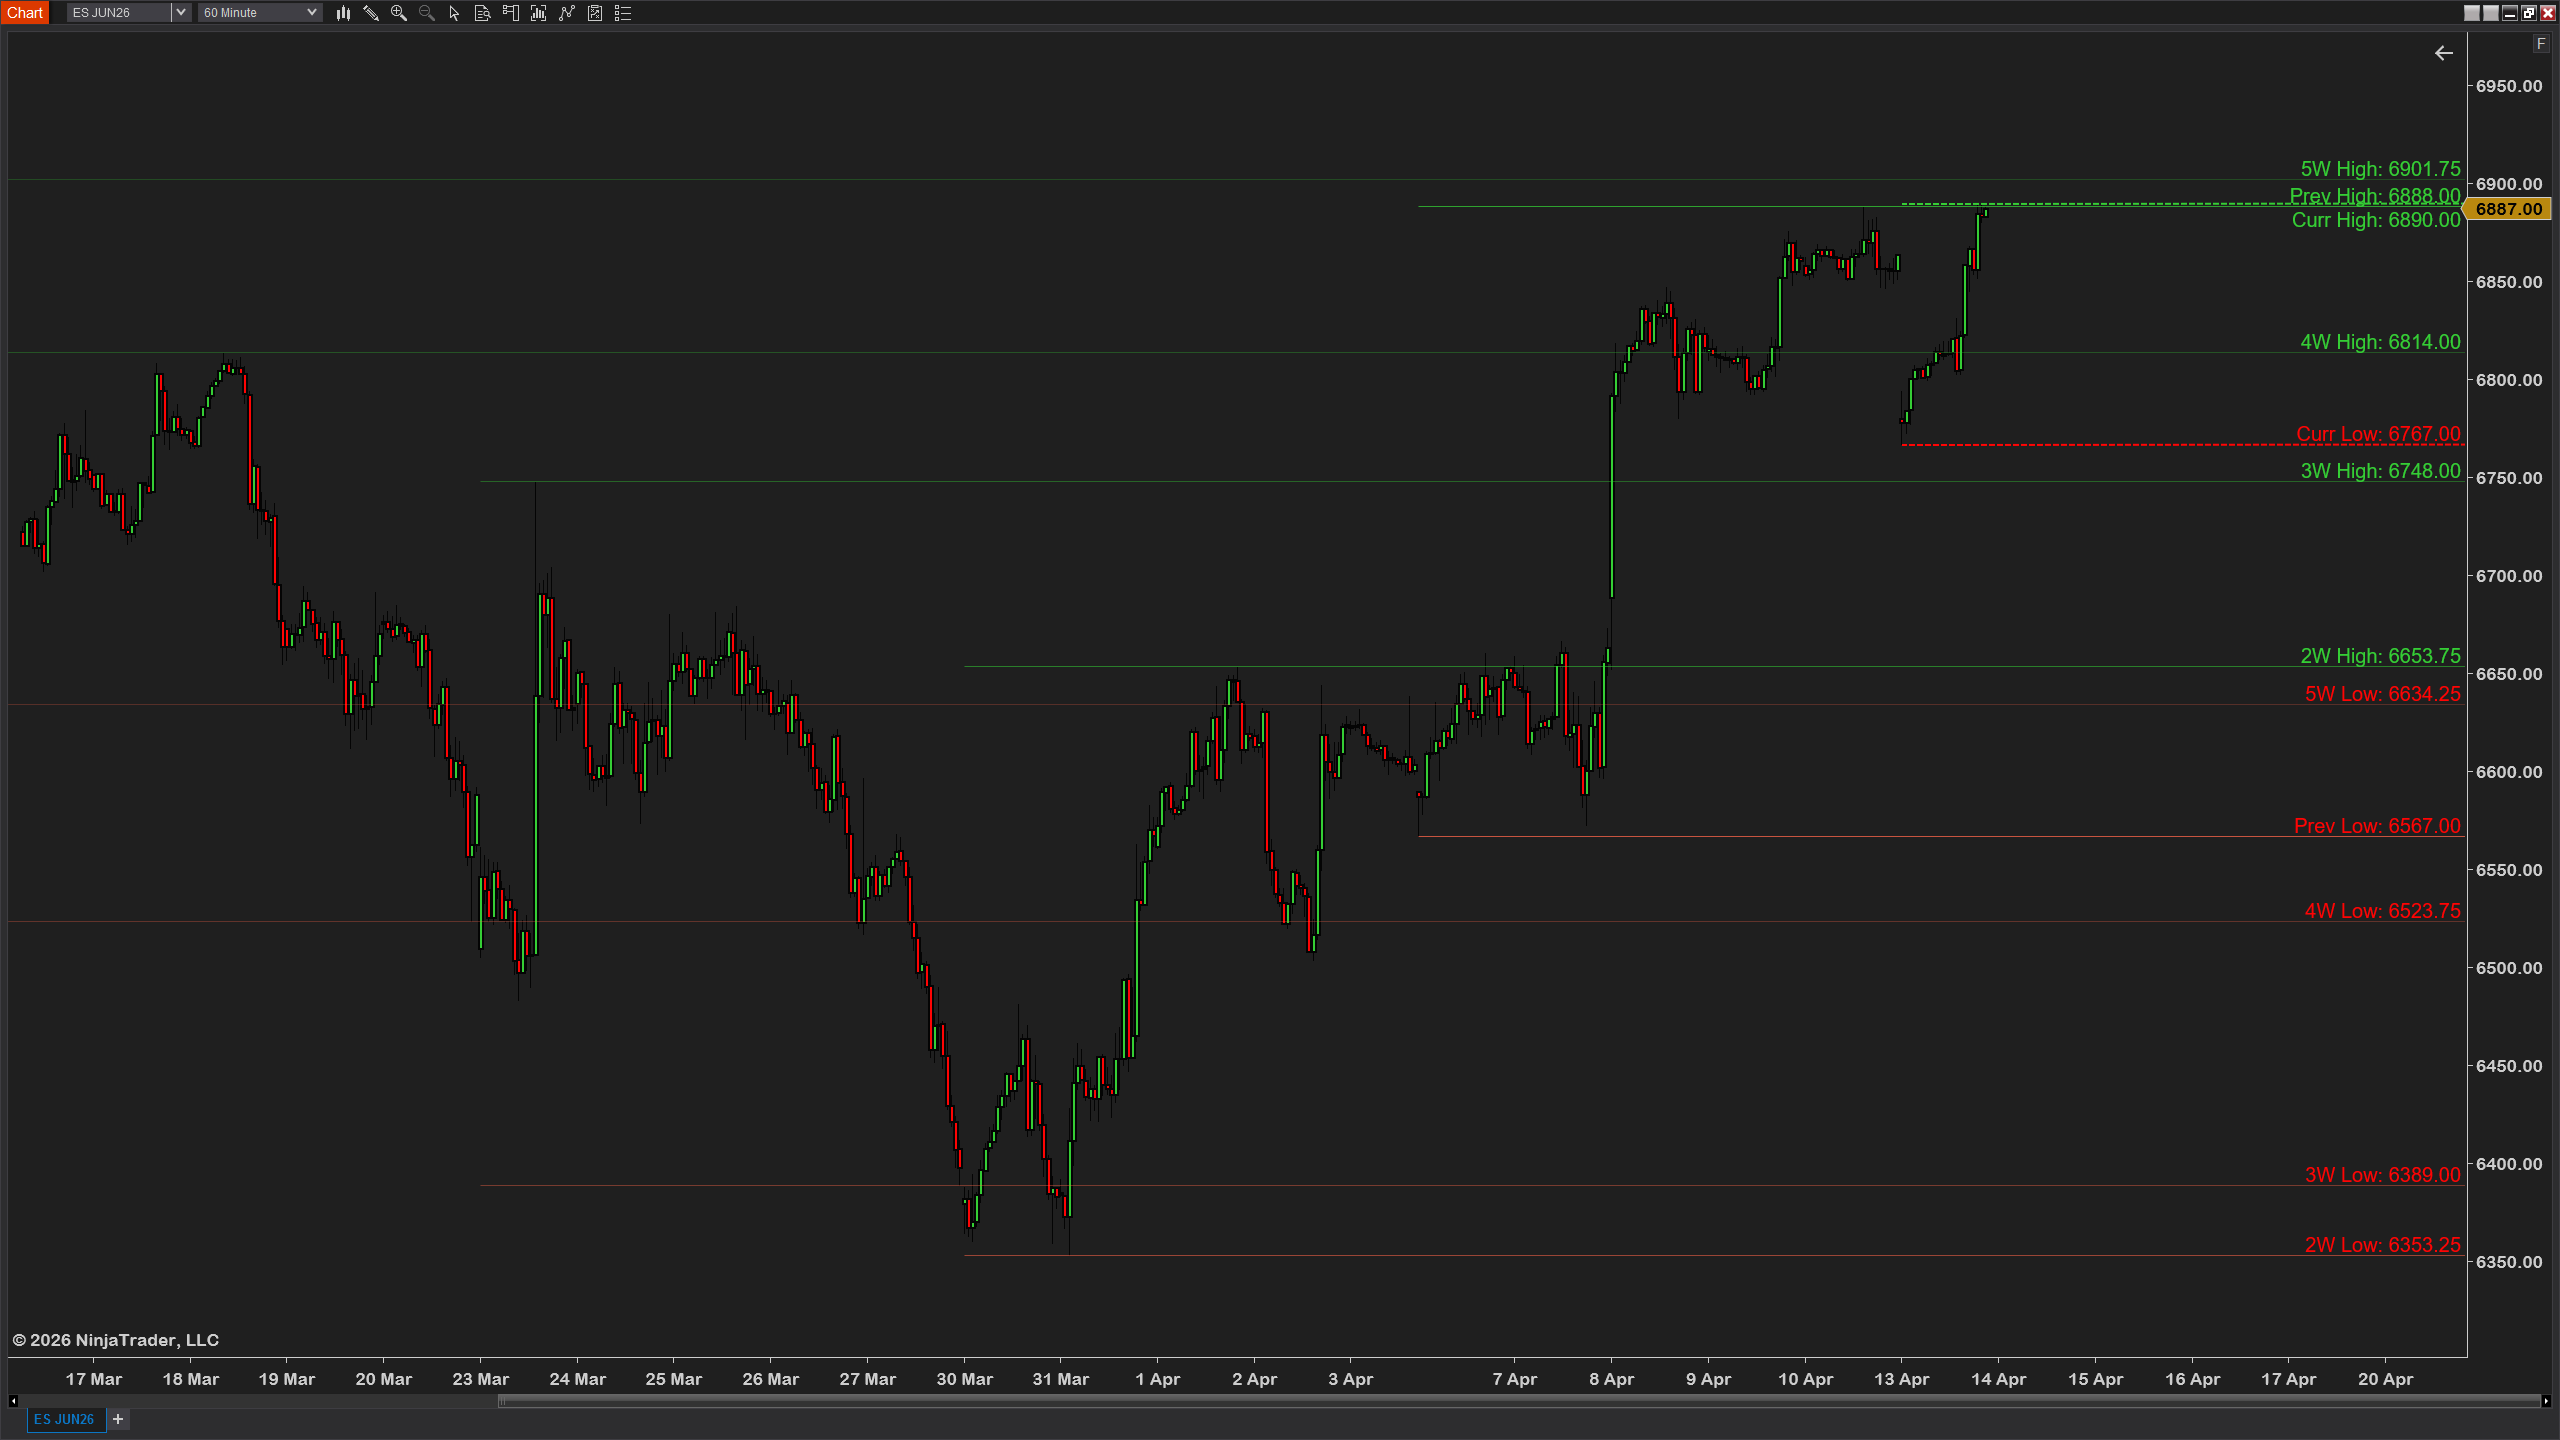
Weekly highs and lows are where pro traders measure the bigger structure. The weekly high you tagged and rejected three sessions ago is often where price returns. The weekly open tells you the week's bias — above it, bulls control; below, bears do. Weekly H/L Lines draws up to ten weeks of weekly highs, lows, mids and opens with right-edge labels showing the price, the week (W -1, W -2 etc.), and the month for context. Built for futures with Sunday-evening week start by default, switchable to Monday for stocks. Optional confluence detection highlights levels stacking within ticks of each other. Free, fully audited, and built for traders who read the weekly chart.
"Cleanest weekly levels indicator I've used. Most weekly H/L scripts only show the current week or maybe last week, so you can't see structure over the last month. This one goes back 10 weeks and labels each one with W -1, W -2, etc., plus the month for context. The Sunday-evening week start matters — most US-built weekly indicators start Monday morning, which means you miss the entire Sunday-night-to-Monday move on futures. The confluence detection highlights when last week's high and the week before's low are within a few ticks. Worth way more than free."

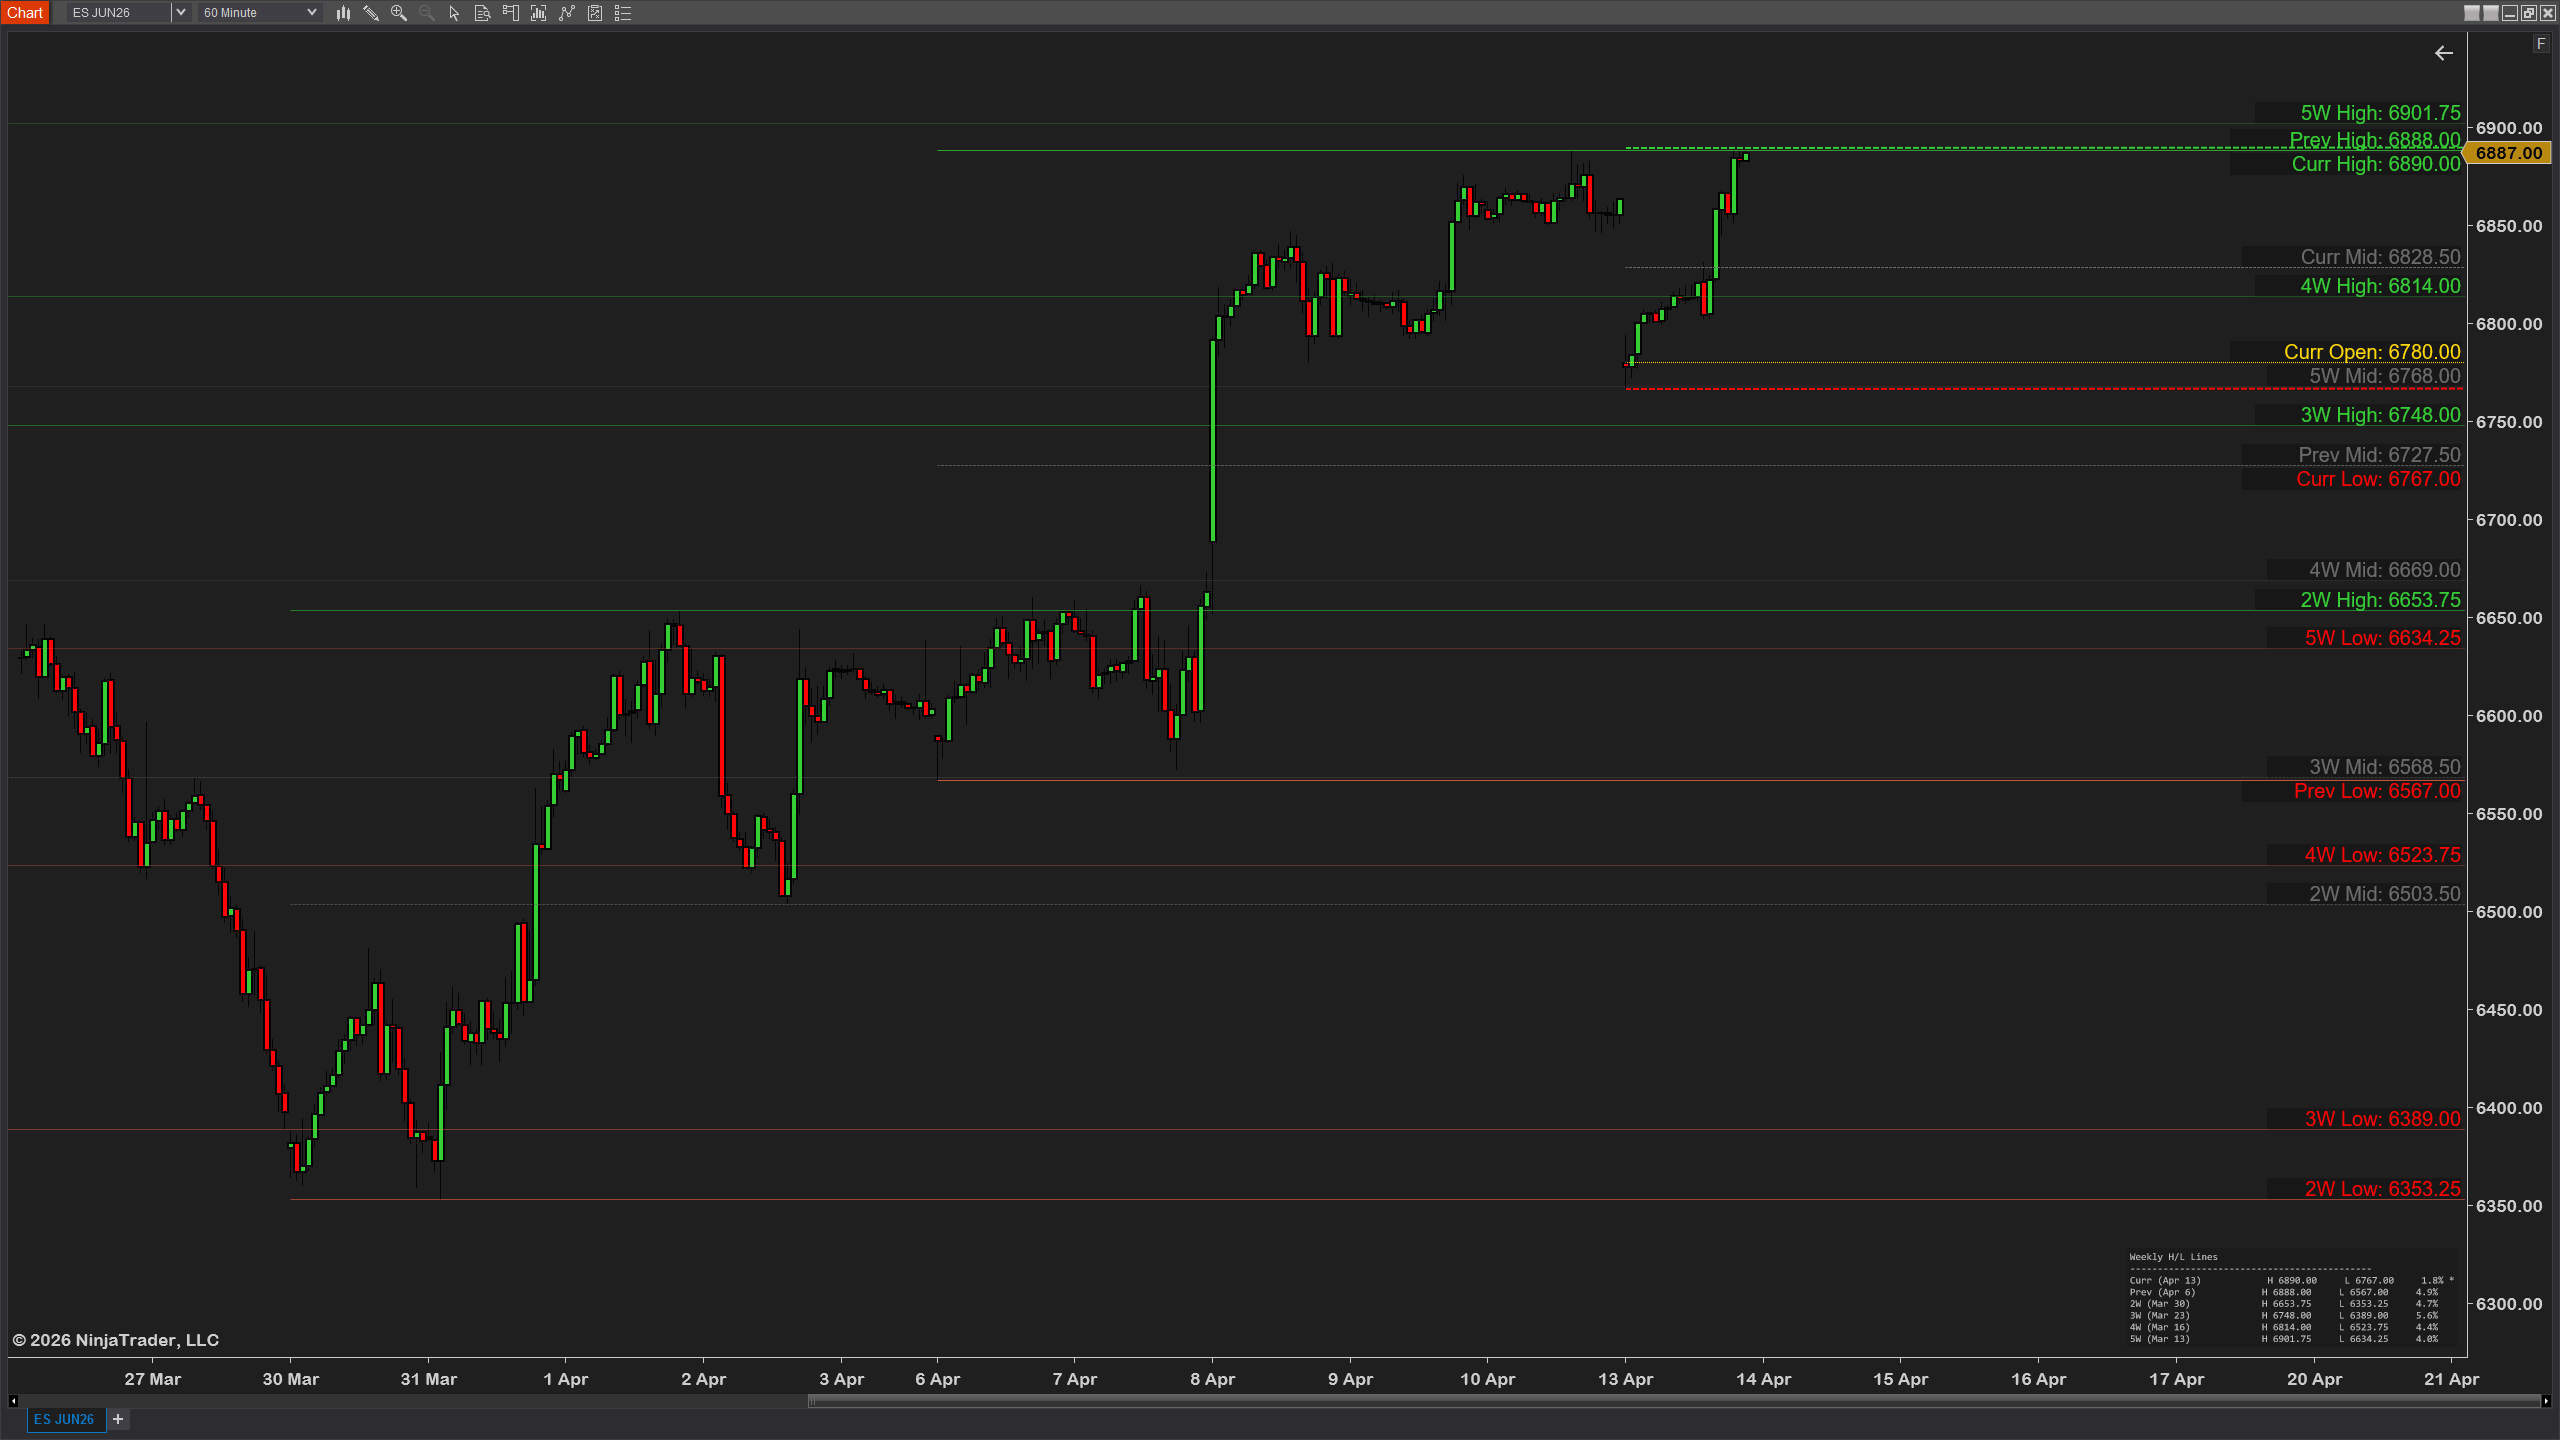
"Replaced two separate weekly scripts with this. The right-edge labels with week tag are exactly what I want — price + W -3 + month so I can read structure at a glance. Clean and works."

"Solid indicator. Would love a 'weeks ahead' projection in a future version but for a free tool what's here is excellent. The Monday week start option is appreciated — most futures-focused indicators ignore stocks."

"Been watching weekly highs and lows for the last decade and this is the cleanest implementation I've seen for NT8. The right-edge labels with the week tag and month context make it instant to read which level is which without hovering. The confluence detection caught me a setup last Tuesday where last week's high was within 4 ticks of the prior week's mid — both rejected on the same touch. Replaced a $50 paid indicator and didn't lose anything."
"Set it up in 5 minutes, works exactly as described. The Sunday-evening week start is right for futures and the indicator handles it correctly out of the box. Highly recommend."