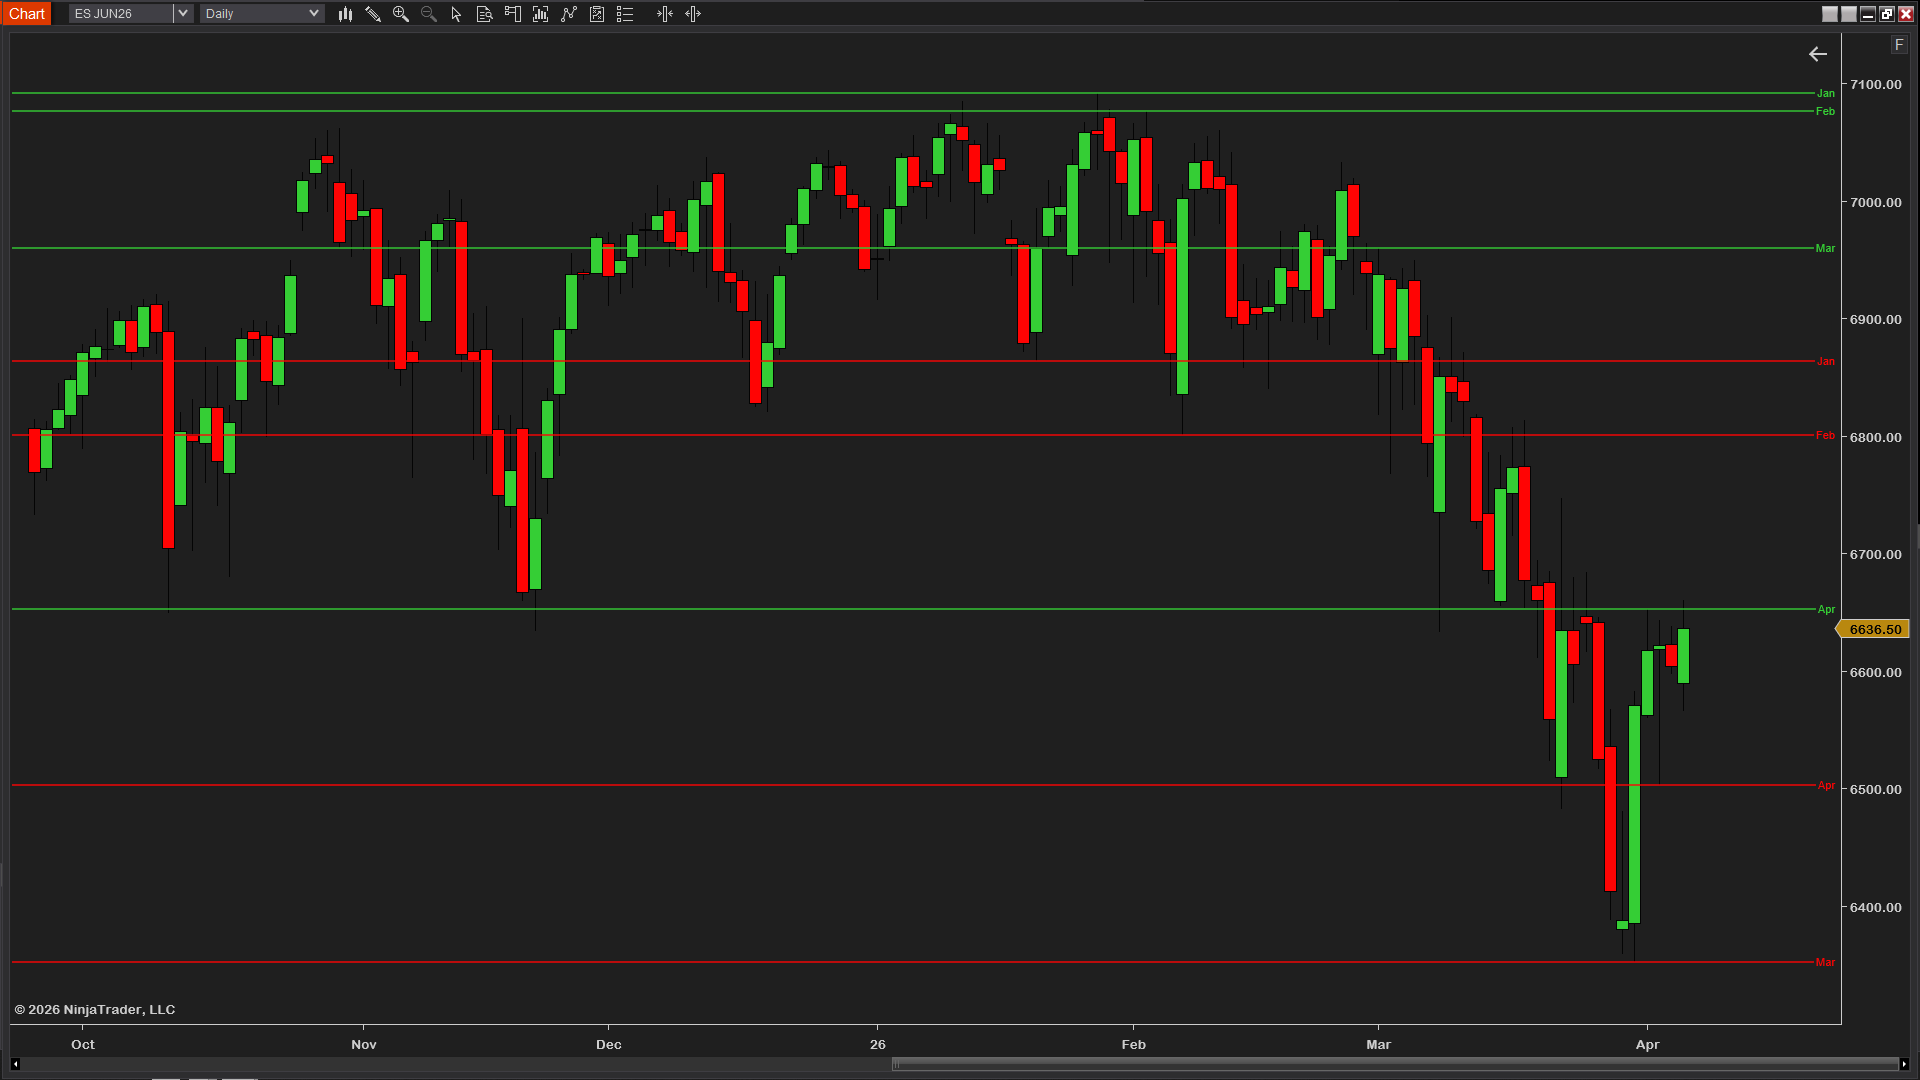
Monthly highs and lows are where swing and position traders measure the longest read on price structure. The monthly high you tagged six months ago can still cap rallies; the monthly open tells you the longer-term bias and serves as a common mean-reversion target on big moves. Monthly H/L Lines draws up to 24 months of monthly highs, lows, mids and opens with right-edge labels showing the price, the month tag (M -1, M -2 etc.), and an optional calendar suffix like (Mar 2026) for context. Optional confluence detection highlights levels stacking within ticks of each other. Free, fully audited, and built for traders who watch the bigger picture.
"Cleanest monthly levels indicator I've used. Most monthly H/L scripts only show the current month or maybe last month — useless for swing trading where you need to see 6 to 12 months of structure. This one goes back 24 months and labels each one with M -1, M -2 etc., plus the calendar tag like (Mar 2026) so I never have to count months back manually. The confluence detection caught me a setup last week where last month's high was within 3 ticks of the prior month's mid — both rejected on the same touch. Worth way more than free."

"Replaced my old monthly script with this. The calendar suffix on the labels is exactly what I want — instead of counting back from M -1 to M -8 I see (Sep 2025), (Aug 2025) etc. directly. Clean and works."

"Solid indicator. Would love a 'half-year' option (last 6 months only, on a separate visual track) in a future version but for a free tool what's here is excellent. Works correctly on stock charts as well as futures."

"Been watching monthly highs and lows for swing trading for years and this is the first NT8 indicator that does it cleanly. The right-edge labels with the calendar suffix make scanning the levels instant — I know which level is which without thinking. The 24-month history is overkill for most setups but the option to set Months to Show = 6 keeps it minimal. The monthly open as a separate line option is exactly what I need for bias reads. Replaced a $69 paid monthly indicator and didn't lose anything."
"Set it up in 5 minutes, works exactly as described. The full 4-digit year on labels (e.g. Mar 2026) is much clearer than the apostrophe-shortened format other indicators use. Highly recommend."